Benchmark QA Tool
Turned a 3-day manual QA process into a 20-minute automated workflow for e-commerce UX datasets — built iteratively from Colab scripts to a full Flask application.
The Problem
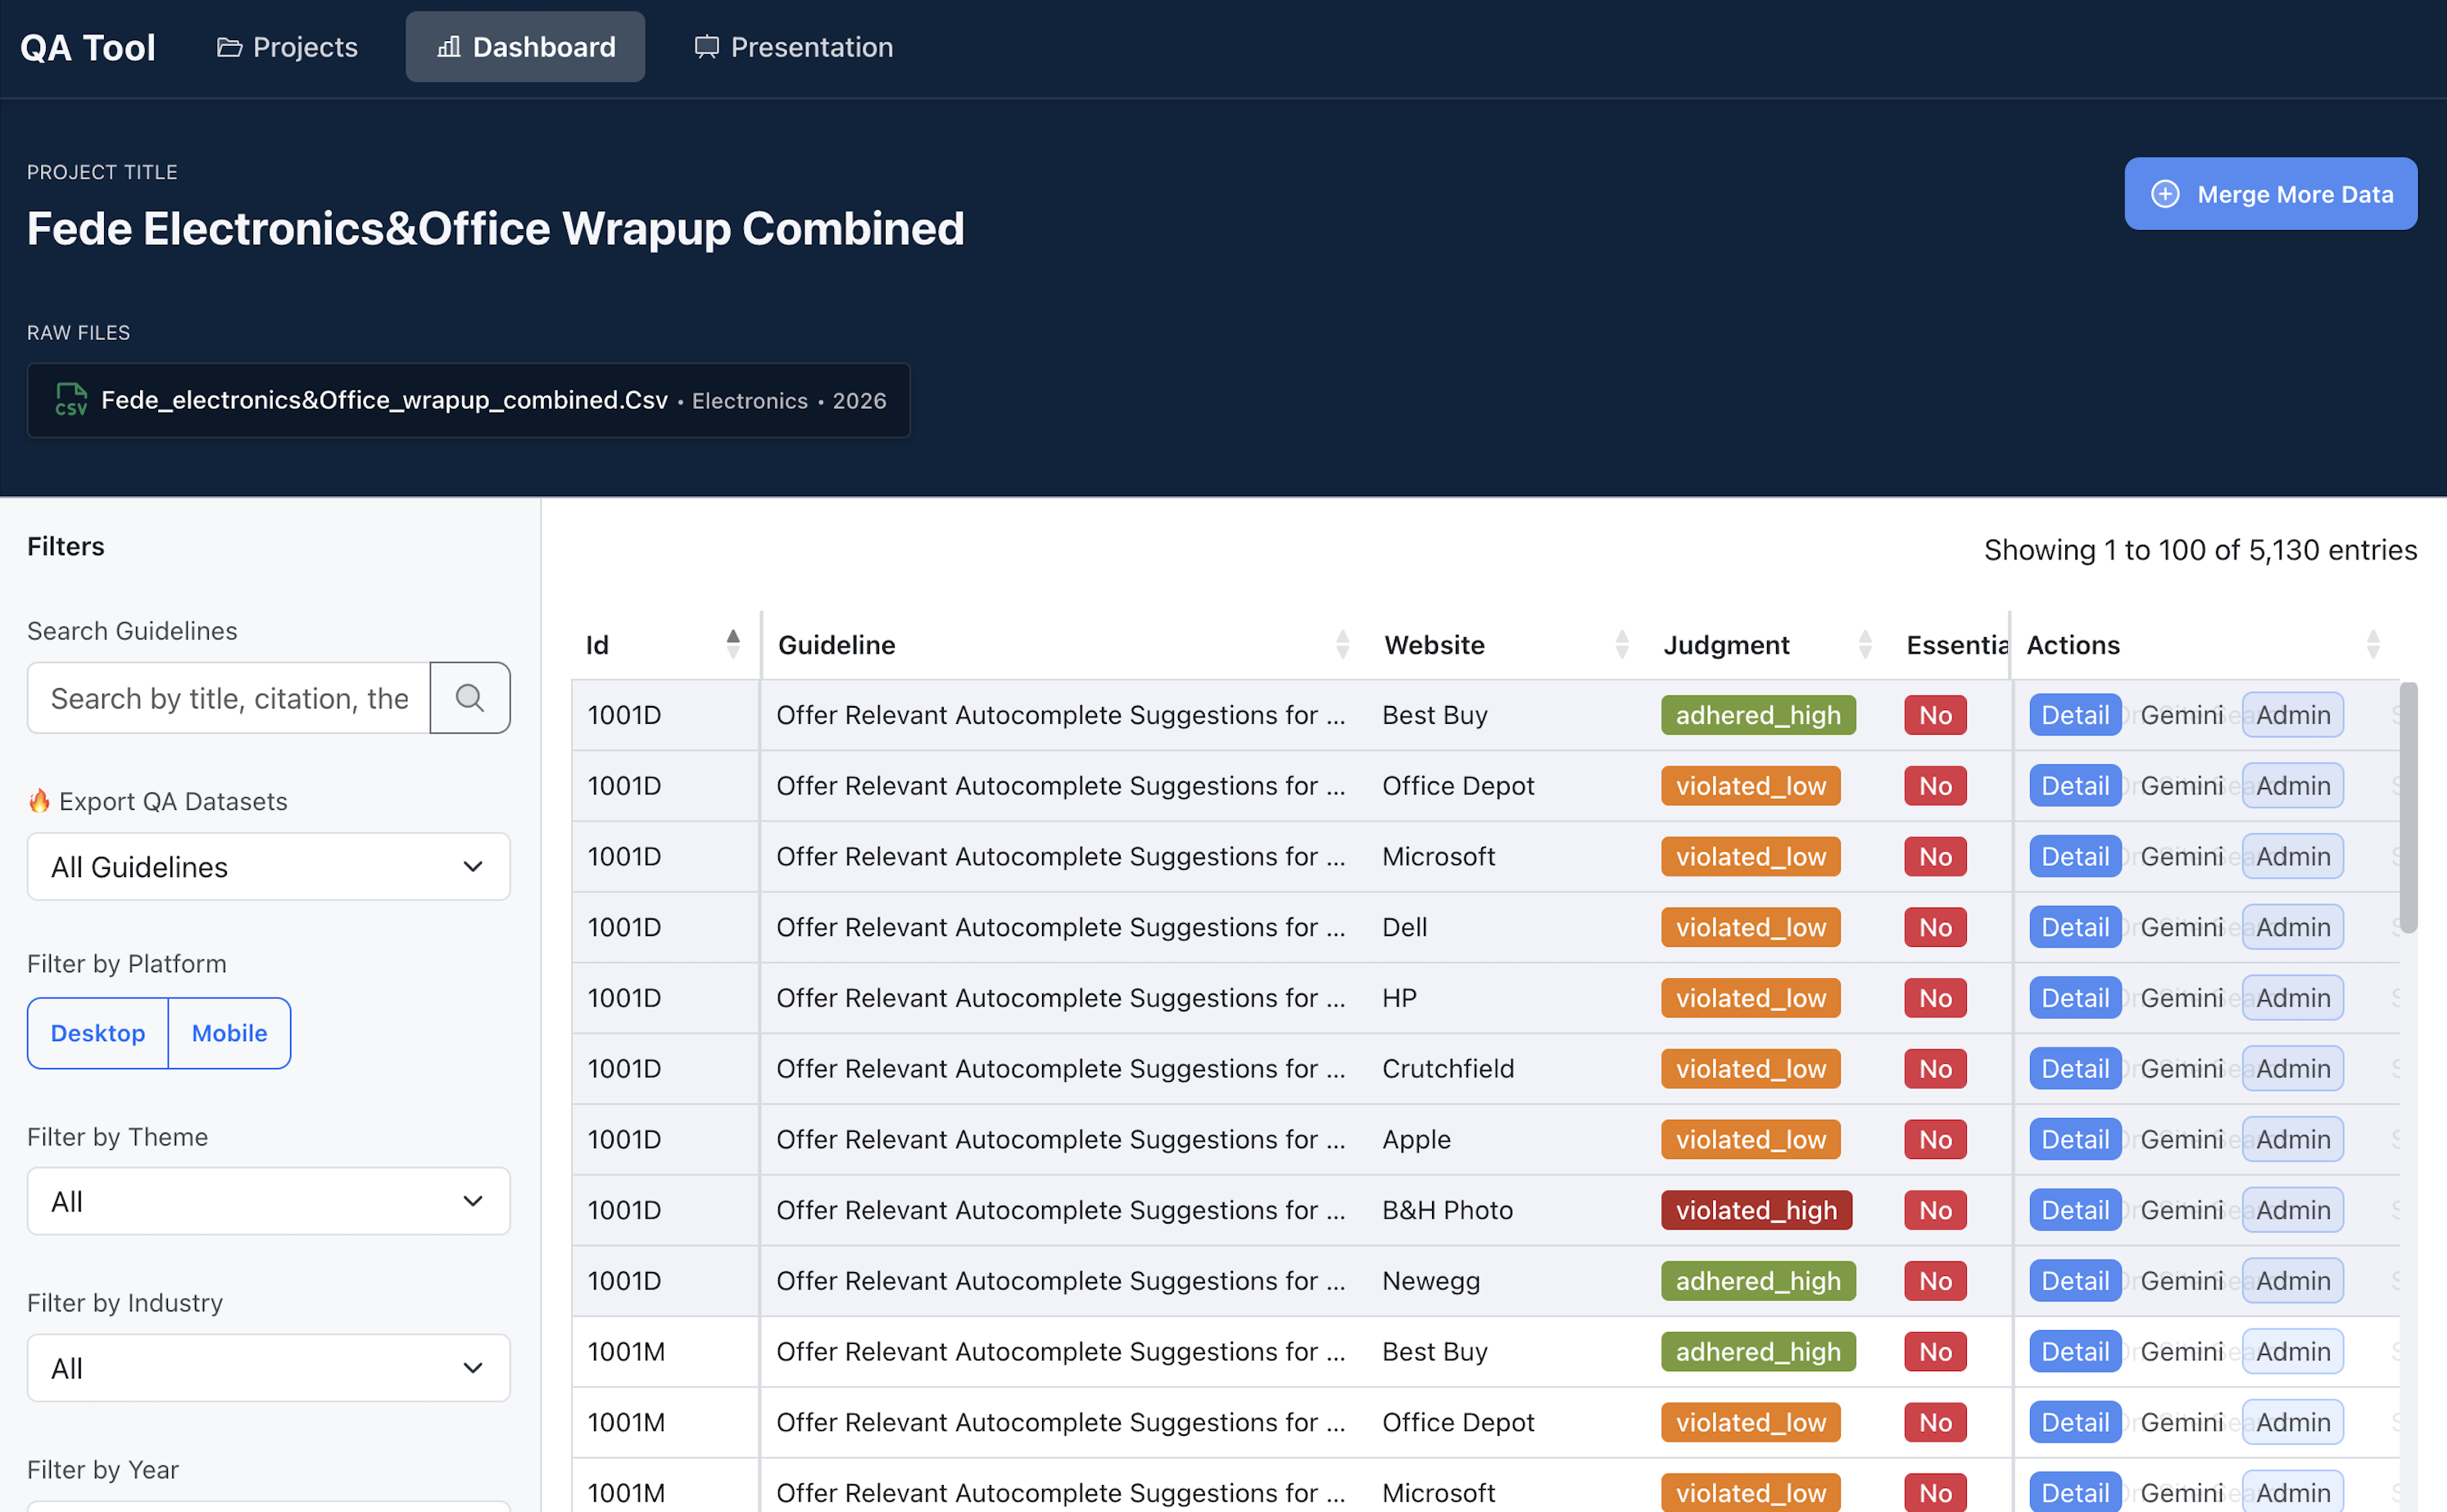
Baymard Institute evaluates e-commerce UX across hundreds of sites, generating datasets with thousands of datapoints. The QA process was a bottleneck — researchers drowning in Excel files, no version control, peer reviewers catching typos instead of real issues, and no way to see the actual UI while correcting evaluation data.
Nobody asked for a tool. I saw the workflow, opened a notebook, and started building.
Three Iterations, Each One Useful
Colab scripts — automated consistency checks and flagging in plain Python. No infrastructure, no dependencies. Colleagues got value on day one, but they needed me to run every job.
Streamlit prototype — wrapped the scripts in an interactive UI so researchers could run checks themselves. Proved the interaction model worked: dashboard, filtering, guideline detail view. But Streamlit's routing and pagination hit limits fast.
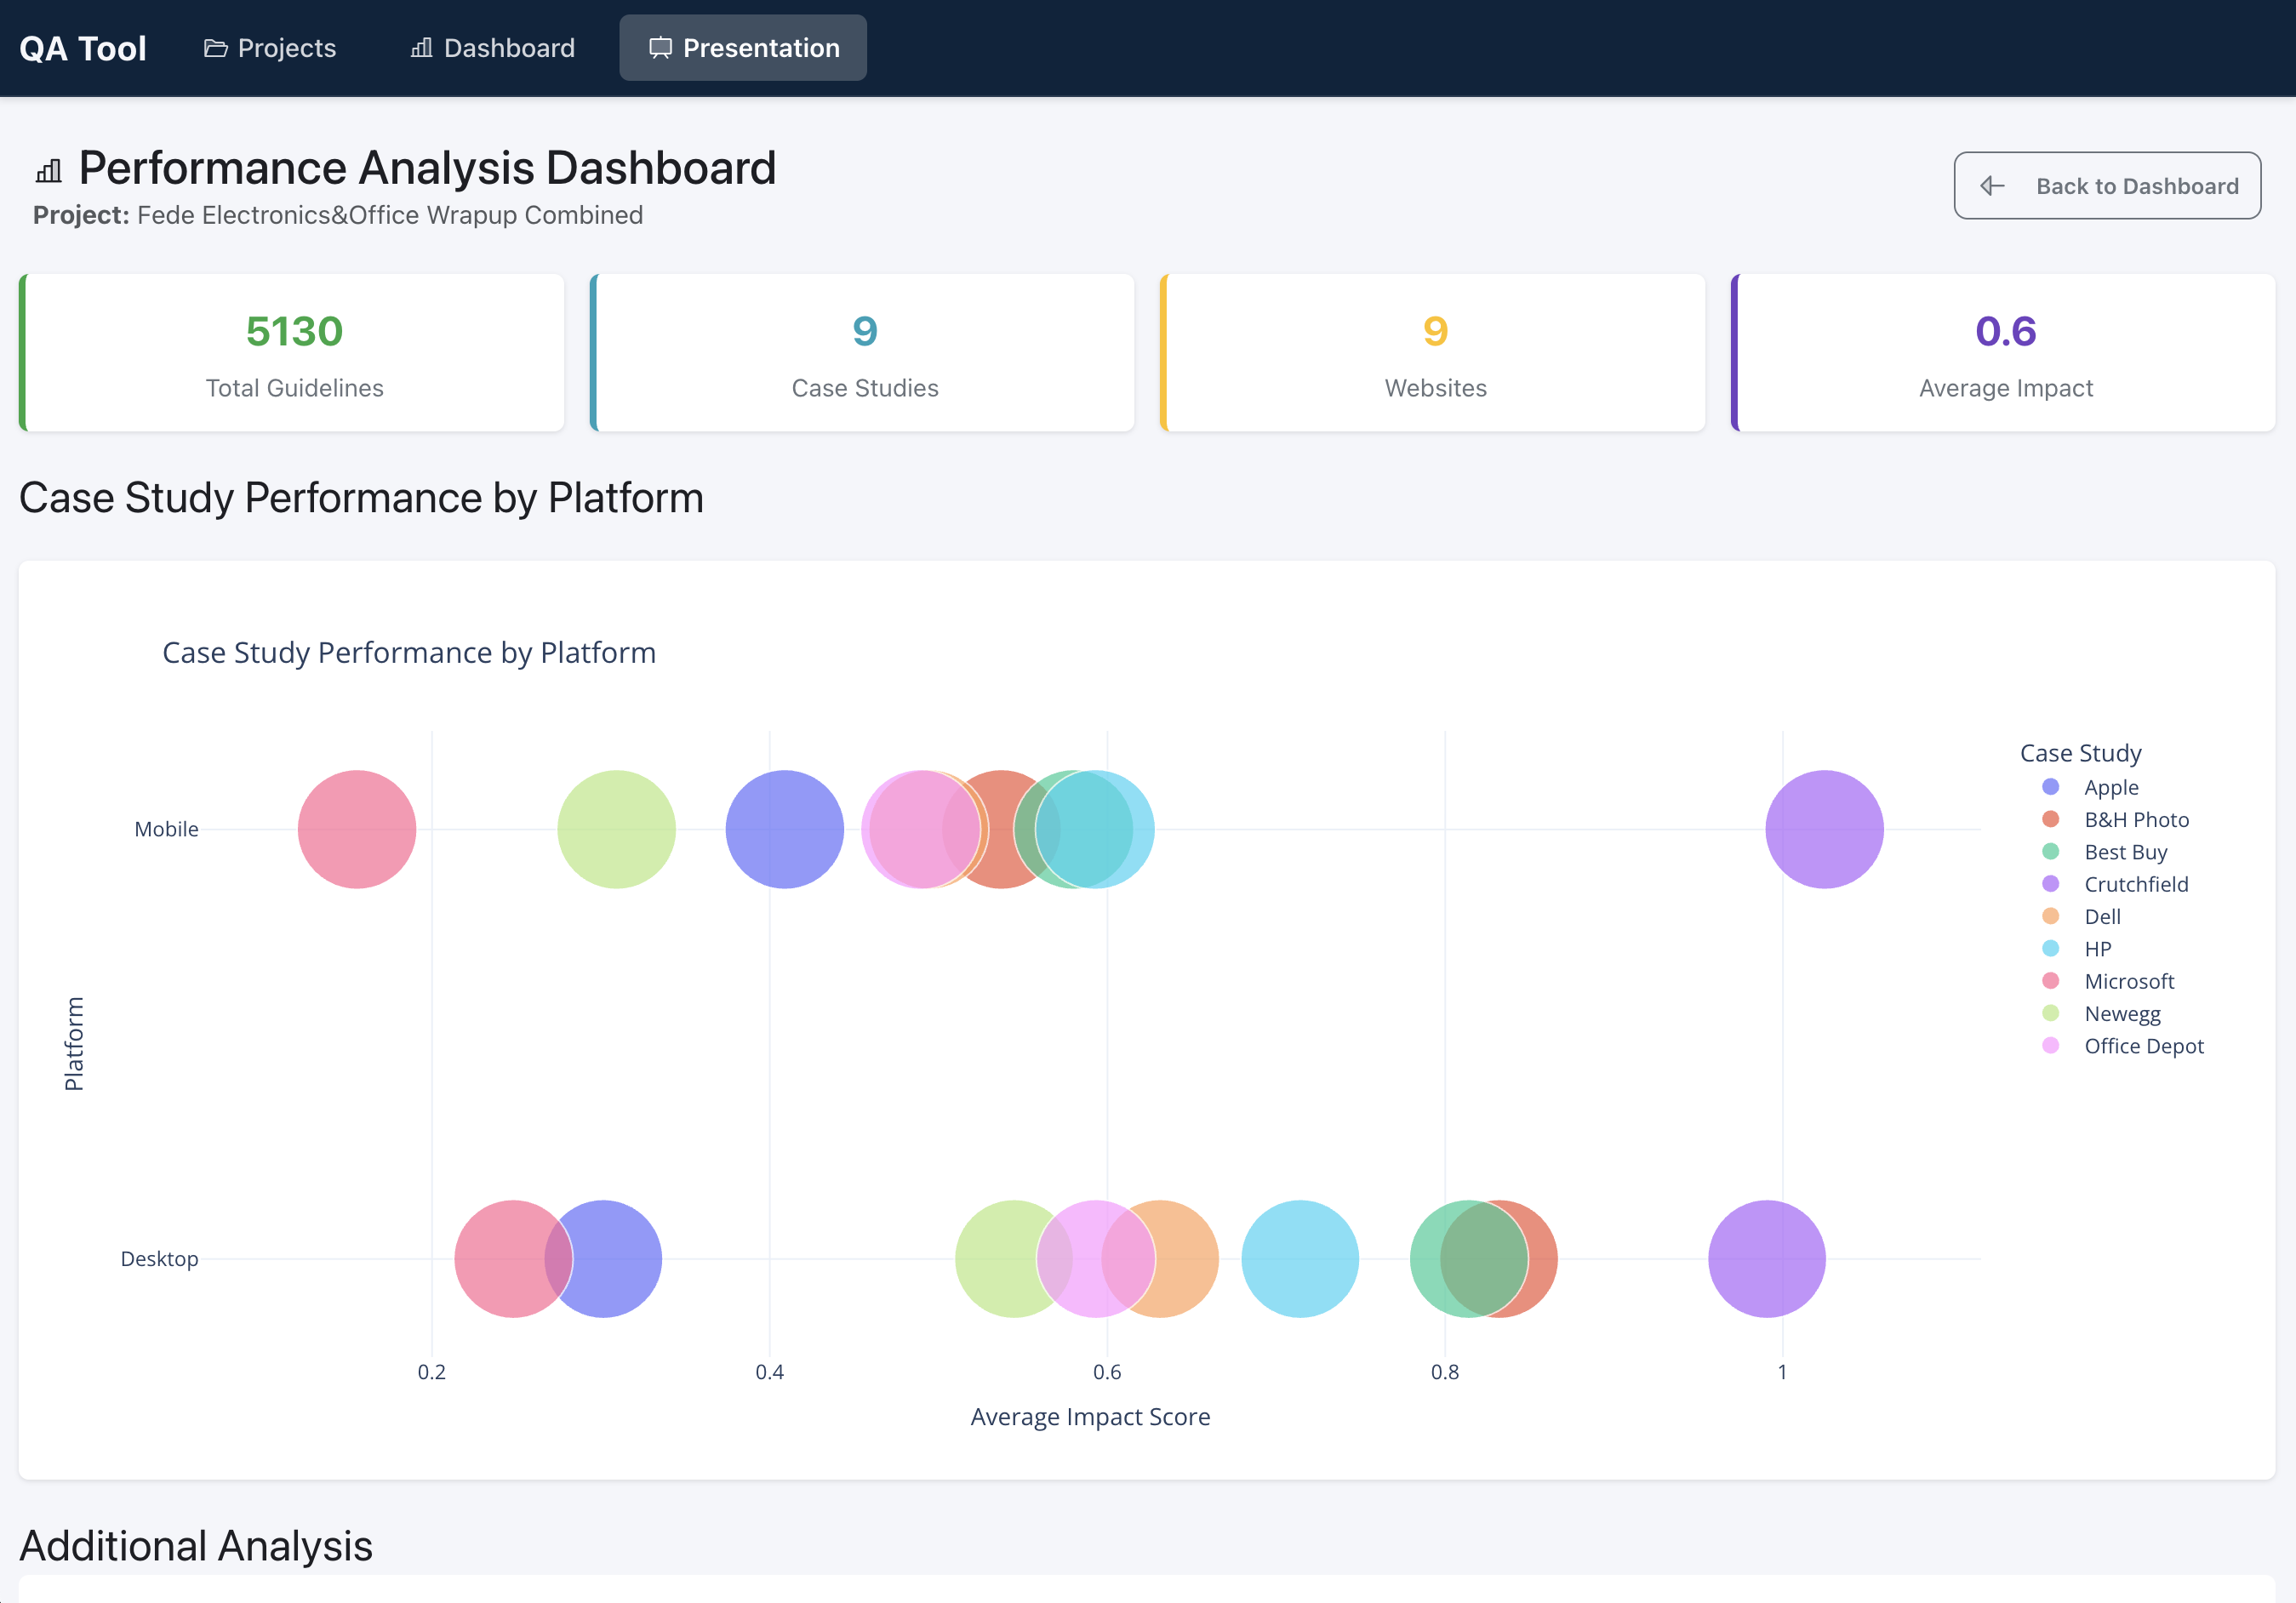
Flask application — the production version. Proper pagination, role-based permissions, export pipelines, and a modular validation system where new checks plug in without touching the rest.

See the UI While You Fix the Data
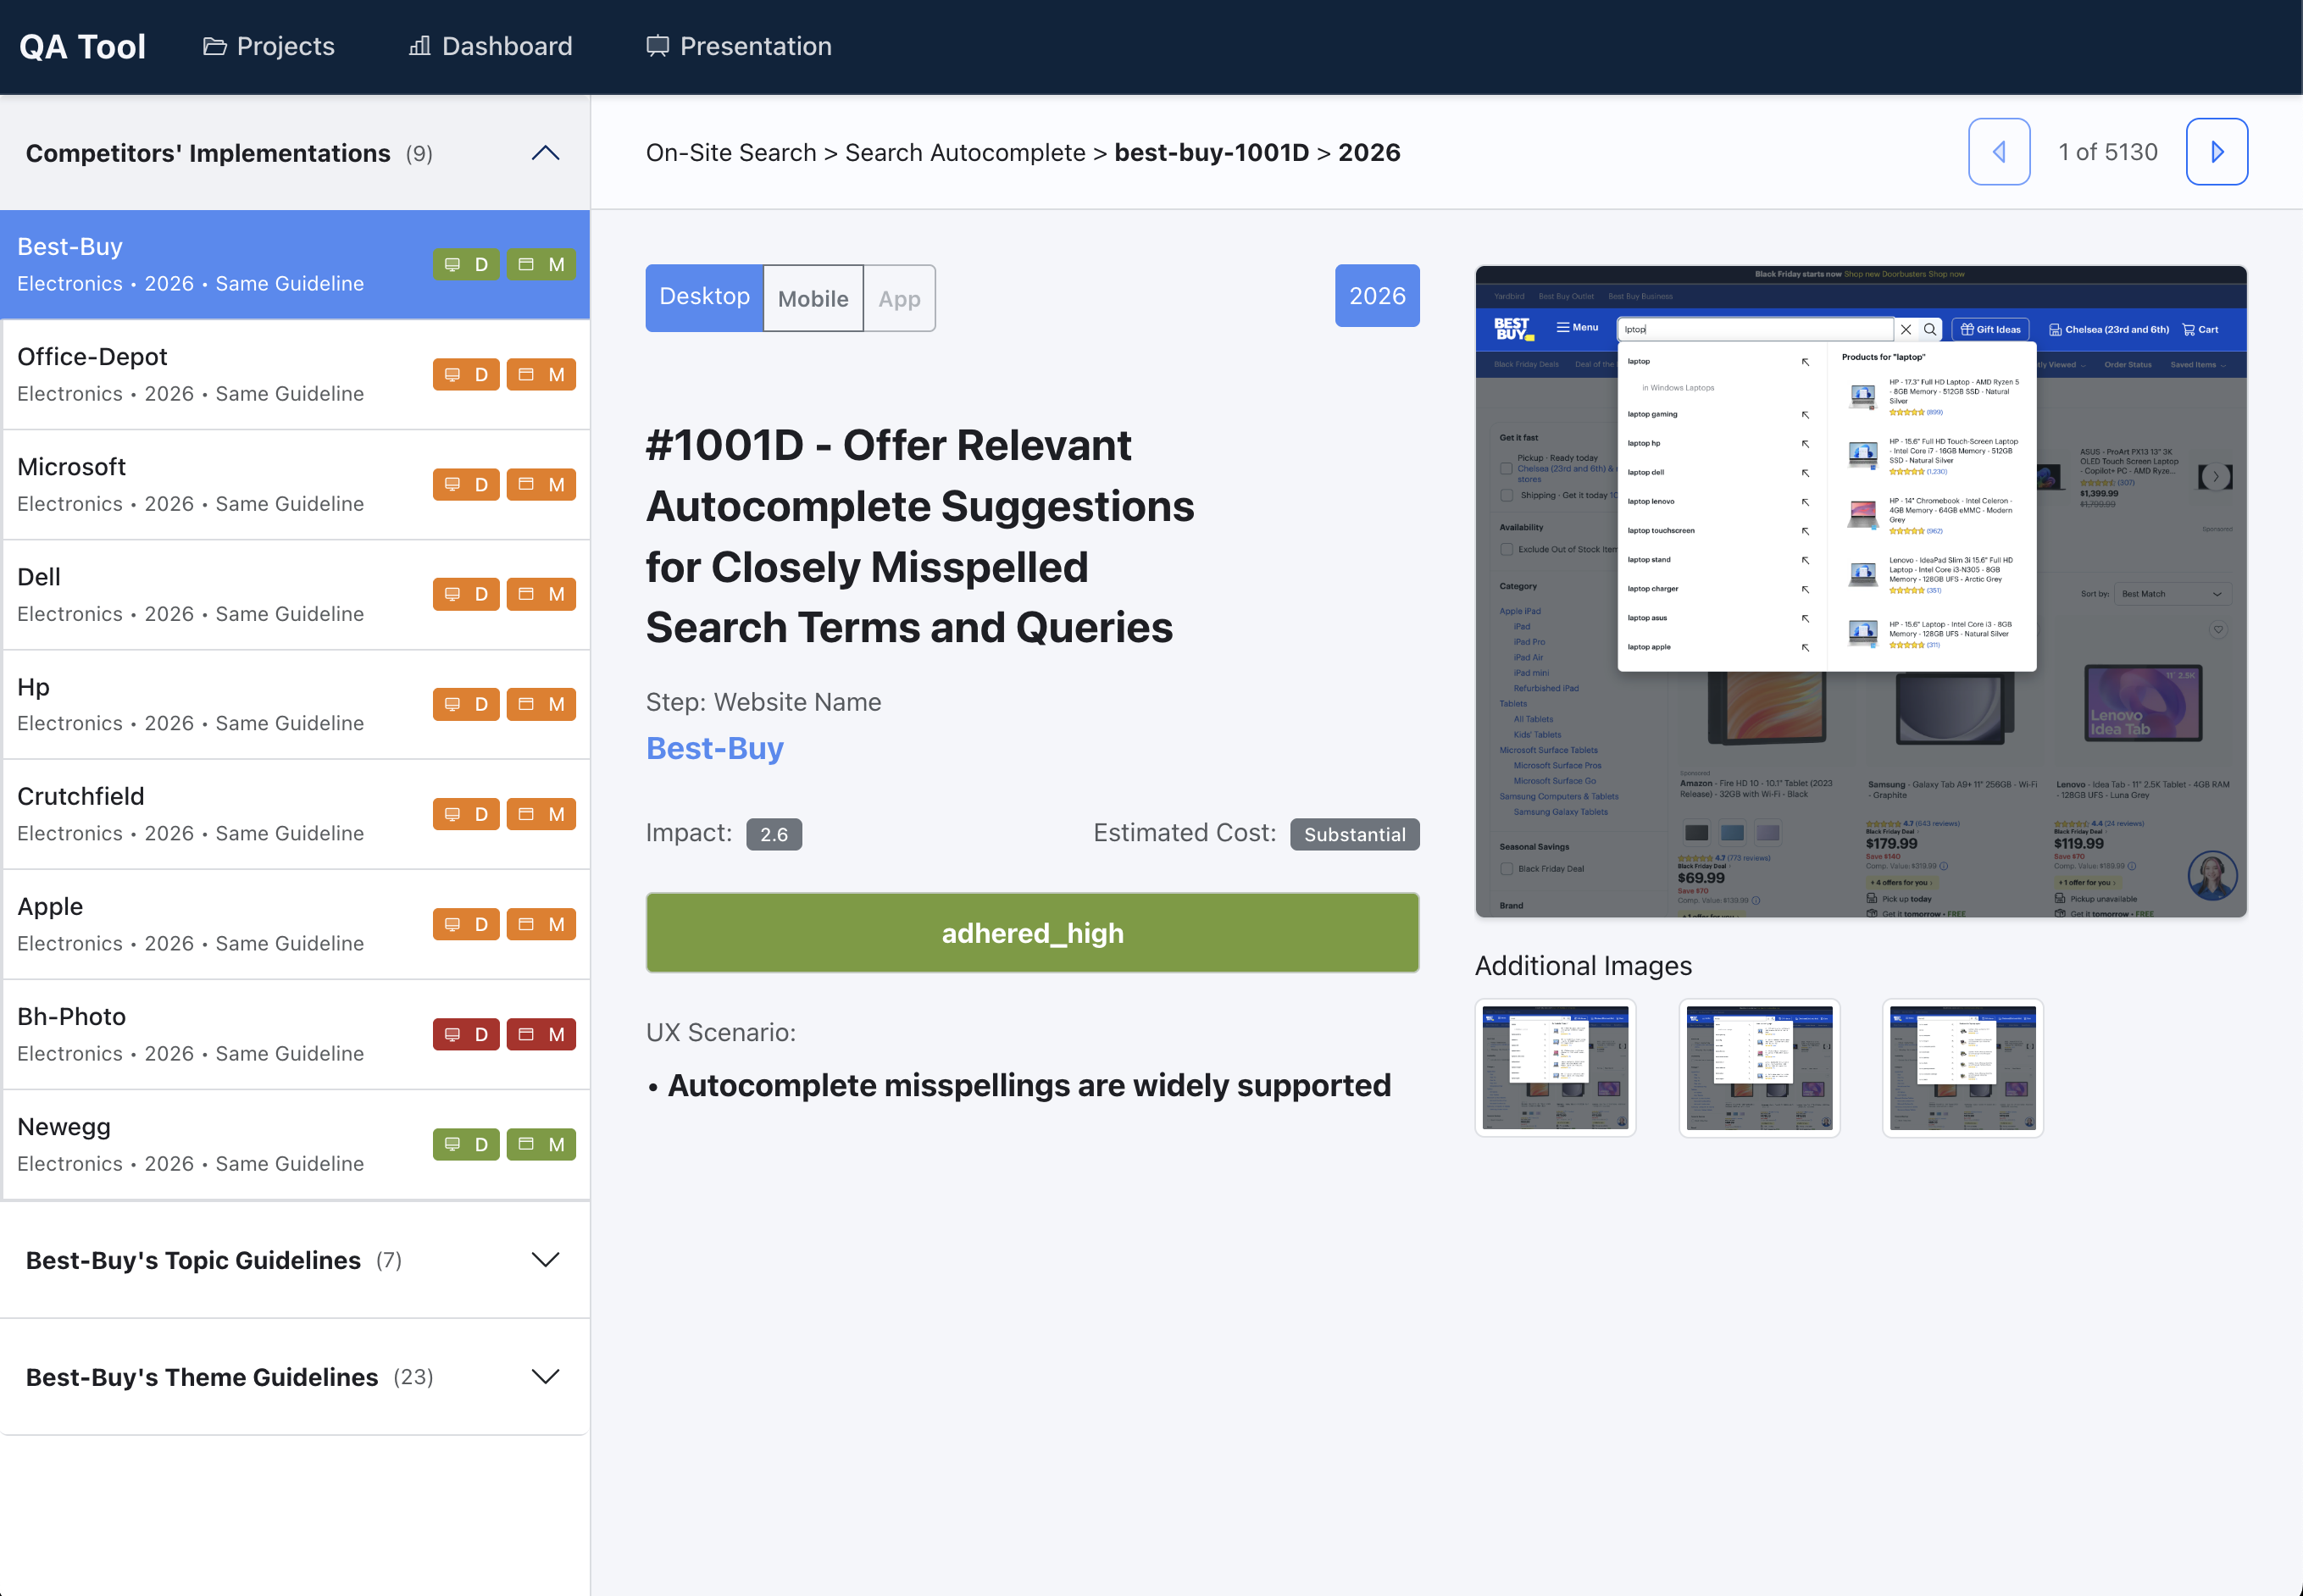
The core insight: researchers were correcting evaluation data blind. They'd read a judgment about a checkout field but couldn't see the actual checkout. Every correction required opening a separate browser, finding the site, navigating to the right page.
The detail view shows the actual UI screenshot next to the data being reviewed. Exported images are automatically captioned with the evaluation judgment — feeding other departments with pre-labeled best practice examples without extra work.
From Fragile Export to API
The original data pipeline was manual — researchers exported projects from the platform, copy-pasted into Excel, cleaned by hand. The first prototype used a Playwright script to import projects by ID, but it required login credentials, crashed on large payloads, and broke when the UI changed.
The final version: a proper API integration built in collaboration with the platform developers. Type the project IDs, reviews load in seconds. Solid, authenticated, handles any payload size.
How This Got Built
No mandate, no spec, no sprint ticket. I saw a broken workflow, prototyped a fix in a notebook, validated it with the team, and iterated to production — delivering usable output at every stage. The tool is still in daily use.